Tuesday, 14 June 2016

Words are great, but color is better when it comes to social media marketing

Social Media is a multimedia experience. Content is shared in a myriad of forms: video, text, photo, audio clip, gif, etc. All can benefit a company’s brand in the effort to reach viewers. But we now know that color plays a very important part in brand perception. According to recent research, the color palette creates the mood and feeling of a brand that ultimately drives consumer behavior. Color, when used effectively, has the ability to connect with the subconscious (gut feeling) which can be a direct line to a positive customer action.
However, there are some who still argue that the perception of color is too dependent on personal experience to have universal applications such as the psychology researchers at the University of California, Berkeley who learned that, "personal preference is determined by all the entities you've encountered of that color and how much you liked them."
Although this may be true in some cases, the true benefits of color in marketing are apparent when the “perceived appropriateness” of the color being used fits the brand image and feel. 
As author Gregory Ciotti states, “certain colors do broadly align with specific traits (e.g., brown with ruggedness, purple with sophistication, and red with excitement). But … it’s far more important for your brand’s colors to support the personality you want to portray instead of trying to align with stereotypical color associations.”
A company creating or revamping their brand image should consider long and hard the colors they select. Color choices that enhance the feel of the brand will be perceived as successful and more impactful than color choices that are at odds with the desired feeling of the company.
Ciotti continues, “Focusing on the way colors affect the feeling, mood, and image that your brand creates that play a role in persuasion. Be sure to recognize that colors only come into play when they can be used to match a brand’s desired personality (i.e., the use of white to communicate Apple’s love of clean, simple design).”
The study of color theory is vast and much information can be found online, but for a basic introduction, check out this video on branding and color…
When done wisely, color choice will lead to successful brand recognition and even instill a sense of trust. Ideally correct color application will positively affect the company’s brand perception metrics, including brand loyalty, brand recall, “top-of-the-mind recall” or “share of mind” and the ultimate, “share of heart” metric.
According to the SMstudy Guide, the “share of heart” metric indicates the highest level of brand loyalty and recognition. The book states, “A high ‘share of heart’ indicates a very strong connection between the brand and its customers…and that the marketing strategy is effective at communicating and delivering the value needed by its customers.”
Harnessing the power of color (and applying it appropriately) will enhance a company’s social media marketing and has the potential to increase viewer and customer engagement no matter what form of media is being shared.
For more interesting articles on social media marketing, visit - www.smstudy.com/articleshttp://www.smstudy.com/Article/words-are-great-but-color-is-better-when-it-comes-to-social-media-marketing
Monday, 13 June 2016

The New Battleground for Brands

Consumers rely on their mobile devices to keep them in-the-know in order to make decisions regarding their personal and professional lives. Think about it, on average you check your smartphone 85 times per day. That’s 85 chances for companies to get their brand seen. And most companies have attempted to optimize this opportunity by expanding their reach through mobile apps, but have fallen flat.
Here’s why: micro-moments, or “intent-driven moments of decision-making and preference-shaping that occur throughout the entire consumer journey.”  
Let me break it down for you a little further. People use their smartphones to purchase products, look up information, and watch videos. Sometimes they just reflexively turn to their device. According to Google, “In these moments, consumers' expectations are higher than ever. The powerful computers we carry in our pockets have trained us to expect brands to immediately deliver exactly what we are looking for when we are looking. We want things right, and we want things right away.”
So what can we do? According to Digital Marketing, book 3 in the SMstudy® Guide, “Rich media ads are image ads incorporating animations or other elements that provide users with ways to interact with the ad. Such elements are often customized to match user behavior. The targeted and personalized nature of the ads is intended to generate greater engagement, resulting in more views and clicks.” These types of ads woo users into making the clicks that get them to the right thing right away.
Here are a couple easy tips for creating the perfect micro-moments for your company to fully get use of those dollars it spends on marketing:
Create a blueprint: we all need to start somewhere, and the best place is the drawing board. Figure out what your target consumers are looking for and when. It is helpful to use Google Analytics to assist this process. With this data you can efficiently decipher what draws consumers to your brand and at what time. Time is an important factor that many companies overlook. Consumers are more likely to search for information on their phone while they are performing a task, so releasing a micro-moment during regular business hours can promote viewers to keep on viewing. Provide your audience with what they want, when they want it.
Understand your consumers: People process visuals 60,000 times faster than text, so give the people what they want, videos! Quick thirty-second to one-minute videos that engage consumers will increase click-rates from the micro-moment to your website. It is important to create the right moments that make consumers want to learn more about your brand.
Create a moment that seamlessly leads to your product. This may seem like a no-brainer, but the content you create, whether it be visuals or text, better give the consumer relevant information about something they are interested in as well as information about your product. There needs to be a connection between the two. A good example of this is Dunkin’ Donuts. The company released an app that not only navigates you to the closest Dunkin’ Donuts coffee shop, but also depicts the wait time at each location, so customers can plan their route to the coffee shop with the least amount of wait time. The app and the micro-moment that was launched with the start of the app seamlessly takes the consumer to the product.
Become one of the successful brands that use micro-moments to market products, and for any questions refer to SMstudy.com to help you with all of your sales and marketing needs.
http://www.smstudy.com/Article/The-New-Battleground-for-Brands

Friday, 10 June 2016

Contemplating Ones Corporate Navel; Analyzing Market Opportunity and SMstudy

With the world breathlessly awaiting the next new super child of business, the hot topics in the dreams of entrepreneurs everywhere are innovation and disruption. Yet, the topic that will make the difference between a super child and an abandoned orphan will be market opportunity.
“An analysis of market opportunities is important because businesses operate in dynamic and constantly evolving environments, so understanding the changing landscape and trends that are impacting the business helps in developing an effective marketing strategy,” says Marketing Strategy, book one of the SMstudy® Guide series. This is true of established businesses developing innovations as well as startups pushing the envelope.
 There’s an adage that says “we make our own opportunities.” The first place to look then is inside one’s self. To a significant extant that is true of business opportunities as well. That is why it is important for a company exploring new innovations to look closely at “the concepts related to analyzing the internal capabilities of [the] company as well as the factors of the external environment that impact the business,” according to Marketing Strategy. In other words, starting a new venture is a good time to contemplates one’s corporate navel.
The Guide recommends using the first two parts of a SWOT analysis—determine strengths and weaknesses—for this introspection. This step is especially necessary for entrepreneurs, who are often in the process of creating the company that will develop and deliver the innovation or disruption. These first parts of a SWOT analysis can be tailored to tell the innovator which strengths should be incorporated into the new organization and which ones should be avoided. Instead of asking, “what are our company’s strengths based on past successes?” the entrepreneur can ask, “what strengths do companies that have succeeded with similar products and services possess? And how can our new company get them?”
Marketing Strategy identifies four inputs that can aid in this process: senior management direction and insights, organizational capabilities, assumptions and constraints and existing market research reports. Obtaining senior management insights may seem impossible for a new company with no senior executives; however, innovation does not happen in a vacuum. That’s why both Thomas Edison and Alexander Bell had to defend themselves against more than one hundred patent suits. There are sources for expert opinion and insights.
Organizational capabilities will have to be tweaked again for entrepreneurs starting companies. Instead of taking an inventory of existing capabilities—in all areas such as finance, operations, human resources, location, intellectual property and organizational culture—startups must determine what capabilities they will need in each of these areas.
“An assumption can be defined as anything that is considered to be true without proof,” says Marketing Strategy. While assumptions are necessary when making plans that deal with the uncertainty of the future, “assumptions related to Sales and Marketing should be clearly thought through and explicitly stated, validated and agreed upon before deciding on any specific strategy or marketing plan.” Assumptions are the home of unrealistic expectations for many innovators and visionaries. They should be agreed upon with extreme caution, clarity and common sense.
Most industries have numerous associations that produce researched reports on current developments and market trends. For example, project management has the Project Management Institute’s Pulse of the Profession report. Governments and institutions of higher learning issue reports almost constantly.
Whatever information the next super child needs, it is out there. And if it has to do with sales and marketing, it is available from SMstudy.

For more interesting articles on sales and marketing visit SMstudy.com 

Thursday, 9 June 2016

Evolution of a Logo

Walk through any airport and you’ll experience the power of logo. Starbucks’ green siren beckons from down the terminal, easily recognized 200 yards away. Cinnabon’s royal blue ribbon assures you there’s a tasty treat waiting for you. McDonald’s, Burger King, TGIF, Chili’s—you know them. All have risen to the top of the logo ecosystem, known and understood by consumers across the country and often around the globe.
Communicating the “right” message via a logo is of critical importance throughout the life of any company. According to theSMstudy® Guide, “This image communicates the promise of value the customer will receive from [their] product or products.” A logo becomes the most recognizable symbol of a company or brand and ideally should be unique, adaptable, timeless and appropriate. These four characteristics identified by Inc. are considered essential for a great logo.
Having a unique logo is essential for companies or brands to be easily identifiable in the vast consumer marketplace, such as in the airport terminal scenario above. So when it comes to logo updates and changes, Business Insider reminds us that the process is a delicate one and that certain qualities must remain constant.
Business Insider’s Jason Nazar says, “Every brand hopes to elicit from its logo (a sense of) fondness and comfort with a touch of excitement. Every logo must walk the fine line between nostalgia and modernity; you want to remain your lovable self, while staying current.”
With all these factors to consider, logo evolution can become a dicey affair. But as Inc. points out, logo adaptability and appropriateness allow for, and indeed require, revamping from time to time. Many companies are willing to risk the public backlash—an ever-lurking possibility—and make changes for the sake of keeping up with customer tastes.
Companies have tackled the problem of keeping logos “lovable” but also making them “current” in various ways. Some companies have adopted a gradual design evolution approach while others have opted for more dramatic transformation.
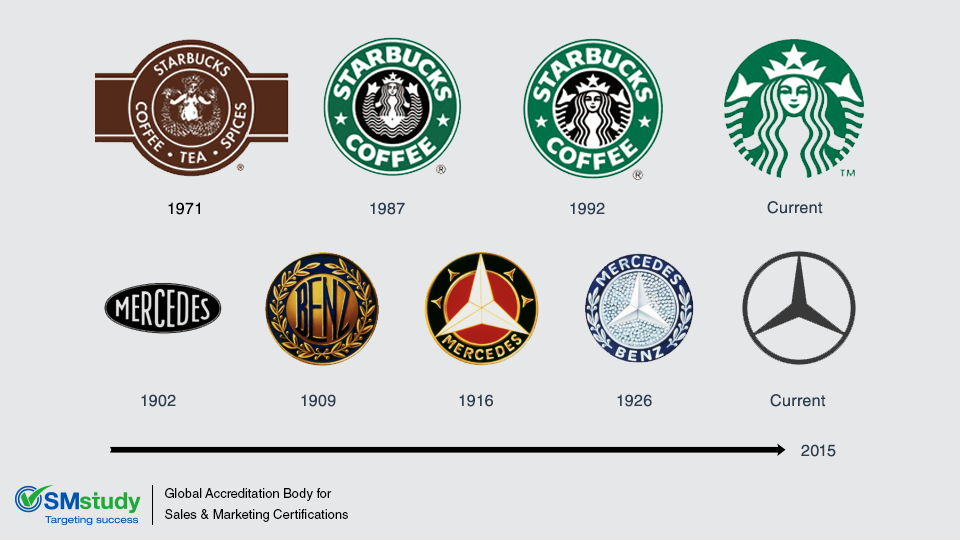
One of the logo success stories that’s made gradual design iterations to reflect the changing tastes of customers over the years is the coffee giant Starbucks. Since its founding in 1971, Starbucks has evolved its logo to project a modern aesthetic yet keep its most memorable elements. 

Wednesday, 8 June 2016

Effective Methods of Determining Sales Force Size

In most companies, the sales force is the most critical part of the business; thus determining the sales force size is critical in planning for sales governance. Although the corporate sales team is one of the most valued assets of the company, it can also be expensive to maintain. Increasing the size of the sales force may increase sales volume but at a higher cost to the company. It is therefore necessary to determine the optimal sales force size. The size of the sales force will also affect territory design.
The three most commonly used methods to determine sales force size are as follows:
Breakdown Method
This is the simplest method among the three. In this method, each member of the corporate sales team is assumed to possess the same level of productivity. In order to determine the size of the sales force needed, the total sales figure forecasted for the company is divided by the sales likely to be generated by each individual.
However, this method fails to account for differences in the ability of salespeople and the difference in potential of each market or territory. It treats the sales force as a function of the sales volume, and does not take profitability into account.
Workload Method
The workload method is also known as the buildup method. In this method, the total workload (i.e., the number of hours required to serve the entire market) is estimated. This is divided by the selling time available per salesperson to forecast the size of the sales force. This method is commonly used since it is easy to understand and to recognize the effort required to serve different categories of customers.
However, this method also has some shortcomings. It assumes that all accounts in the same category require the same effort. Other differentiating factors such as cost of servicing, gross margins, etc. are not considered after the accounts are categorized. It also assumes that sales persons are equally efficient, which is generally not true.  One way to overcome this shortcoming is to adjust the sales force size, determined in the last step, for efficiency. The sales force can be classified into different categories based on their efficiency and the actual number of sales persons required can then be calculated with this adjusted number.
Incremental Method
The incremental method is the most precise method to calculate the sales force size. The underlying concept is to compare the marginal profit contribution with the incremental cost for each sales person. The optimal sales force size as per the incremental method is when the marginal profit becomes equal to the marginal cost and the total profit is maximized. Beyond the optimal sales force size, the profit reduces on addition of an extra sales person. Therefore, sales people need to be added as long as the incremental profit exceeds the incremental cost of adding sales people. The main shortcoming associated with this approach is that it is difficult to estimate the additional profit generated by the addition of one salesperson and is therefore difficult to develop.
Thus sales force needs to be properly organized, motivated and compensated in order to have the right size to do the workload, alignment to cover all needs, and keeping them happy and selling. At the end of the day, they are the ones who get the customer to give up their money for the company’s product or service. 

Thursday, 2 June 2016

When is enough too much? Interpreting Marketing Research and SMstudy

Ever look out at the ocean on a cloudy day? The huge gray mass above stretches out to meet the darker gray mass below at a black line on the horizon?
Standing on that beach, some people feel the ocean’s irresistible allure and comforting power. Others feel like they’re being sucked between two insatiable plates that will crush them at that line in the darkness.
An ocean on a cloudy day is an apt comparison for Big Data and metadata. Big Data stretches its expanding, roiling clouds of content over an equally roiling sea of metadata. Both are massive and powerful. They can both be threatening.
The desire to mine Big Data is making billionaires out of “mining equipment companies,” and references to their algorithms, claims of superior computing speed and boasts of expansive storage capacity are everywhere. Big Data is big content, and that content is getting bigger exponentially. How do we find what we need and want? The answer to that question is to be found in marketing research. A company’s marketing research team will develop expertise in web analytics in addition to what they already know about market analytics. They will need to incorporate more and more disciplines to turn data into information, information into knowledge and knowledge into wisdom.
Once one begins to get a handle on Big Data—or at least has a plan on how to handle it—he or she faces that almost surreal world of metadata. From the murky world of spying, the world learned there is useful information that is with the content but is not the content. “Metadata is the ‘data about data’, or the data that can be taken from an individual piece of content,” says Emma Battle in a blog for Success 360.[1]
In 2010, Raffi Kirkovian, a Twitter employee, published a “Map of a Twitter Status Object” that identifies 37 discrete pieces of information contained in a Tweet other than the actual content of the tweet.[2]
Four years later that seems to have grown, “At 140 characters a tweet seems tiny, but it can yield a wealth of information. According to Elasticsearch, a startup that builds software to help companies mine data from social media, there are 150 separate points of so-called metadata in an individual tweet,” says Elizabeth Dwoskin in a Wall Street Journal blog.
For marketing researchers this can be a bonanza, “A marketer can look at tweets sent by their target audience and see that the majority of the tweets have times stamped after 5:00 p.m. The marketer can then conclude that the best time to reach their target audience on Twitter may be after 5:00 p.m.,” says Battle.
How do marketing professionals go from data to decisions? Through interpretation. The data that is collected and analyzed “is used to enable the team to identify patterns, draw conclusions, solve the research problem, and achieve the research objectives,” according to SMstudy® Guide – Marketing Research, a book in the SMstudy® Guide series on sales and marketing.[3]
The Guide recommends that data interpretation start with three important inputs: the analyzed data, the research problem and objectives. During the interpretation process, “findings from the research analysis are compiled and reported to the marketing team and senior management and are ultimately used to inform marketing and business decisions.” In deciding what to compile and what to report, the researcher will rely on the research problem and objectives because they “provide a focused and definite direction to the data interpretation process,” according to the SMstudy® Guide.
With focus and direction, the marketing researcher uses three categories of tools to identify patterns and draw conclusions that will meet their company’s or client’s needs: tables, charts and expert judgment. Tables such as spreadsheets by Microsoft and Google help researchers organize large amounts of data. Some, like Microsoft’s Excel, provide a variety of filters and grouping tools for this purpose.
There are thousands of charts available to the market researcher. When one uses the term “chart” to be a category name that includes diagrams and graphs, the number of methods for visually displaying often complex relationships explodes. TheSMstudy® Guide highlights bar charts, stratum charts, pictograms and cartograms for their usefulness and broad-based familiarity.
Once one has an excellent collection of tables and charts, something is still needed to make complete sense of them all: expert judgment. “The ability to appropriately interpret the data develops with experience. Inexperienced researchers can sometimes interpret data in a preferred way because of their comfort level with a given method. A researcher should try to seek the opinions of industry experts and research experts, who can provide valuable inputs in choosing the best way to interpret data within the given constraints,” says SMstudy® Guide’s Marketing Research book.
When relevant inputs are processed with appropriate tools, the researcher draws conclusions that are used to solve the research problem and inform marketing decisions. In short, accurately interpreted research means you know the problem AND the best solution options. And knowing is a great feeling between the clouds and the ocean.

Wednesday, 1 June 2016

VMEdu and the Way of E-learning

Companies have long known the financial benefits of online training over physical classroom learning. In fact, companies can save anywhere between 50–70 % on training costs by switching to e-learning alternatives. So naturally it was love at first sight for company bean counters and executives; however, humans, or e-learners, clearly were not so impressed.
Early assessments of e-learning iterations were pretty unanimous: they were dry, boring, technically complicated and didn’t satisfy any quality benchmarks. In other words, the courses weren’t top notch, according to Francisco J. Garcia Penalvo, professor at the University of Salamanca who documented the origins and subsequent growth of e-learning in his book, “Advances in E-learning: Experiences and Methodologies.”
“In spite of everything, the growth of e-learning is unstoppable, and every important institution (academic, enterprise, or otherwise) knows about the necessity of creating and developing a department or service specially devoted to this subject. E-learning deserves to be considered as a real revolution, ‘The Globalization of Training,’” Penalvo said.
Many of those early complaints are now in the past as e-learning has matured over the last ten years and evolved into a human-centric learning experience with technology (ironically) aiding the e-learning “revolution” Penalvo speaks of enthusiastically.
Although a reported 20% of surveyed individuals still note technical issues as the main frustration with e-learning, it now appears that technology has caught up with our learning preferences and e-teachers as well as learning management systems (LMS) are tempting more students than ever on a global scale. In 2015, the global market for e-learning was $170 Billion, a staggering increase of $75 billion in five years.
One technology that has allowed tremendous growth in the field of e-learning is the global penetration of mobile phones. At some point in 2016, 2.1 billion smartphones are estimated to be in use around the world. In particular, China, Indonesia and Russia are anticipated to see substantial growth in smartphone usage over the next two years. And in the case of India, smartphone usage is predicted to surpass the U.S. as the second largest user of smartphones in the world by the end of 2016. This boom has opened up a huge population to the opportunity of lifelong learning. This period of intense growth in smartphone use has tracked with the rise in e-learning to such an extent that it has been noted by Ambient Insight Research, an online resource for statistics and information related to the e-learning industry.
The report states “The astonishing growth rates and adoption rates in countries like Laos, Thailand, Uganda, Cambodia, and Ghana are good examples of once-nascent markets that became vibrant revenue opportunities for suppliers in just the last two years (literally "overnight" in the context of a learning technology product lifecycle.)”